
Fail:Eritrea Population 1950-2021 Forecast 2022-2032 UN World Population Prospects 2022.svg

Fail asli (Fail SVG, ukuran dasar 1,074 × 535 piksel, saiz fail: 38 KB)
Ringkasan
| Keterangan |
Deutsch: Visualisierung der geschätzten jährlichen Bevölkerungsentwicklung in Eritrea von 1950 - 2021; Vorhersage der Bevölkerungsentwicklung von 2022-2032 anhand der "mittleren Prognose" ("medium variant") der Vereinten Nationen.
Historische Ereignisse, die eventuell die Bevölkerungszahl verändert haben könnten, wurden eventuell in das Diagramm eingefügt. Daten von Kriegen werden eventuell auch dargestellt um klarzumachen, dass es sich bei den Demographiedaten um zurückdatierte Schätzungen handeln sollte, weil das Land Bevölkerungsteile oder Teile einer Region verloren oder dazugewonnen haben könnte. Militärische Konflikte, die in Nachbarstaaten aufgetreten sein könnten, können mit dargestellt sein, weil sie die Veränderung der demographischen Daten erklären könnten. Zu genannten Ereignisse existieren mindestens Artikel in der englischen Wikipedia. Datumsangaben sowie die Namen der Ereignisse wurden ebenfalls diesen englischsprachigen Artikeln entnommen.
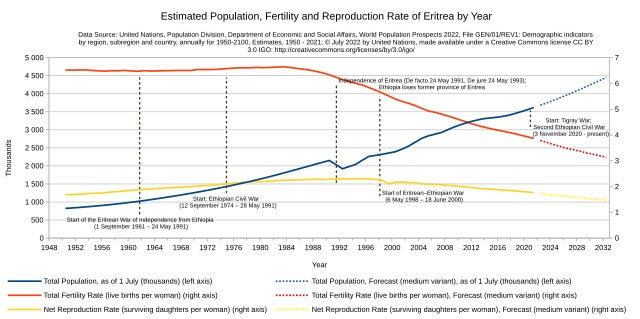
Deutsche Übersetzung: Blaue Kurve: Gesamtbevölkerung jeweils zum 1. Juli in Tausend (linke y-Achse); Blaue gepunktete Kurve: Gesamtbevölkerung jeweils zum 1. Juli in Tausend, "Mittlere Prognose" ("Medium variant") (linke y-Achse); Rote Kurve: Gesamtfruchtbarkeitsrate (Lebendgeburten pro Frau) (rechte y-Achse); Rote gepunktete Kurve: Gesamtfruchtbarkeitsrate (Lebendgeburten pro Frau), "Mittlere Prognose" ("Medium variant") (rechte y-Achse); Gelbe Kurve: Nettoreproduktionsrate (überlebende Töchter pro Frau) (rechte y-Achse); Gelbe gepunktete Kurve: Nettoreproduktionsrate (überlebende Töchter pro Frau), "Mittlere Prognose" ("Medium variant") (rechte y-Achse) Datenquelle (Steht auch im Bild): United Nations, Population Division, Department of Economic and Social Affairs World Population Prospects 2022 File GEN/01/REV1: Demographic indicators by region, subregion and country, annually for 1950-2100 Estimates, 1950 - 2021 POP/DB/WPP/Rev.2022/GEN/F01/Rev.1 © July 2022 by United Nations, made available under a Creative Commons license CC BY 3.0 IGO: https://creativecommons.org/licenses/by/3.0/igo/ Link zur Datenquelle: https://population.un.org/wpp/Download/Standard/MostUsed/; Heruntergeladene Datei: "Complete (estimates and all projection scenarios)" (XLSX, 93,17 MB), abgerufen am 16.07.2022 Link zur Beschreibung der Daten: https://population.un.org/wpp/ Vorgeschlagene Zitierung: United Nations, Department of Economic and Social Affairs, Population Division (2022). World Population Prospects 2022, Online EditionEnglish: Visualization of estimated annual population trends in Eritrea from 1950 - 2021; projection of the population trend from 2022-2032 using the 'medium variant' of the United Nations.
Historical events that may have changed the population may have been added to the chart. Dates of wars may also be shown to make it clear that demographic data should be backdated estimates because the country may have lost or gained population or parts of a region. Military conflicts that may have occurred in neighbouring states may be included because they could explain the change in demographic data. There are at least articles on these events in the English Wikipedia. The dates and names of the events were also taken from these English-language articles. Original names of terms used by the United Nations adopted. Dotted curves basically represent the forecasts for the next 10 years using the United Nations medium variant forecast. Blue curve: Total Population, as of 1 July in thousands (left y-axis); Blue dotted curve: Total Population, as of 1 July in thousands, Forecast ('medium variant') (left y-axis); Red curve: total fertility rate (live births per woman) (right y-axis); Red dotted curve: total fertility rate (live births per woman), Forecast ('medium variant') (right y-axis); Yellow curve: Net reproductive rate (surviving daughters per woman) (right y-axis); Yellow dotted curve: Net reproductive rate (surviving daughters per woman), Forecast ('medium variant') (right y-axis).
|
| Tarikh | |
| Sumber | Karya sendiri |
| Pengarang | Eneliting |
Perlesenan
- Anda bebas:
- untuk berkongsi – untuk menyalin, mengedar dan memindah hasil kerja
- untuk mencampur semula – untuk menyesuaikan karya
- Di bawah syarat berikut:
- pengiktirafan – Anda mesti memberi penghargaan yang berpatutan, bekalkan pautan ke lesen, dan tunjukkan jika perubahan telah dibuat. Anda boleh lakukannya dalam sebarang cara yang munasabah, tetapi bukan dalam sebarang cara yang mencadangkan pemberi lesen mengendors anda atau penggunaan anda.
- perkongsian serupa – Jika anda mengubah, adun semula, atau menokok tambah bahan, anda mesti menyebarkan sumbangan anda di bawah lesen yang sama atau serasi dengan yang asal.
Sejarah fail
Klik pada tarikh/waktu untuk melihat rupa fail tersebut pada waktu itu.
| Tarikh/Waktu | Gambar kenit | Ukuran | Pengguna | Komen | |
|---|---|---|---|---|---|
| semasa | 10:02, 26 Ogos 2022 | | 1,074 × 535 (38 KB) | Eneliting | Historical events that may have changed the population may have been added to the chart. Dates of wars may also be shown to make it clear that demographic data should be backdated estimates because the country may have lost or gained population or parts of a region. |
| 22:30, 24 Ogos 2022 |  | 1,074 × 535 (36 KB) | Eneliting | Uploaded own work with UploadWizard |
Penggunaan fail
2 buah laman berikut menggunakan fail ini:
Penggunaan fail sejagat
Fail ini digunakan oleh wiki-wiki lain yang berikut:
- Penggunaan di en.wikipedia.org