
Fail:Evolution of temperature in the Post-Glacial period according to Greenland ice cores.jpg
Saiz pralihat ini: 800 × 222 piksel. Leraian-leraian lain: 320 × 89 piksel | 640 × 178 piksel | 1,786 × 496 piksel.
Fail asli (1,786 × 496 piksel, saiz fail: 281 KB, jenis MIME: image/jpeg)
Ringkasan
| Keterangan |
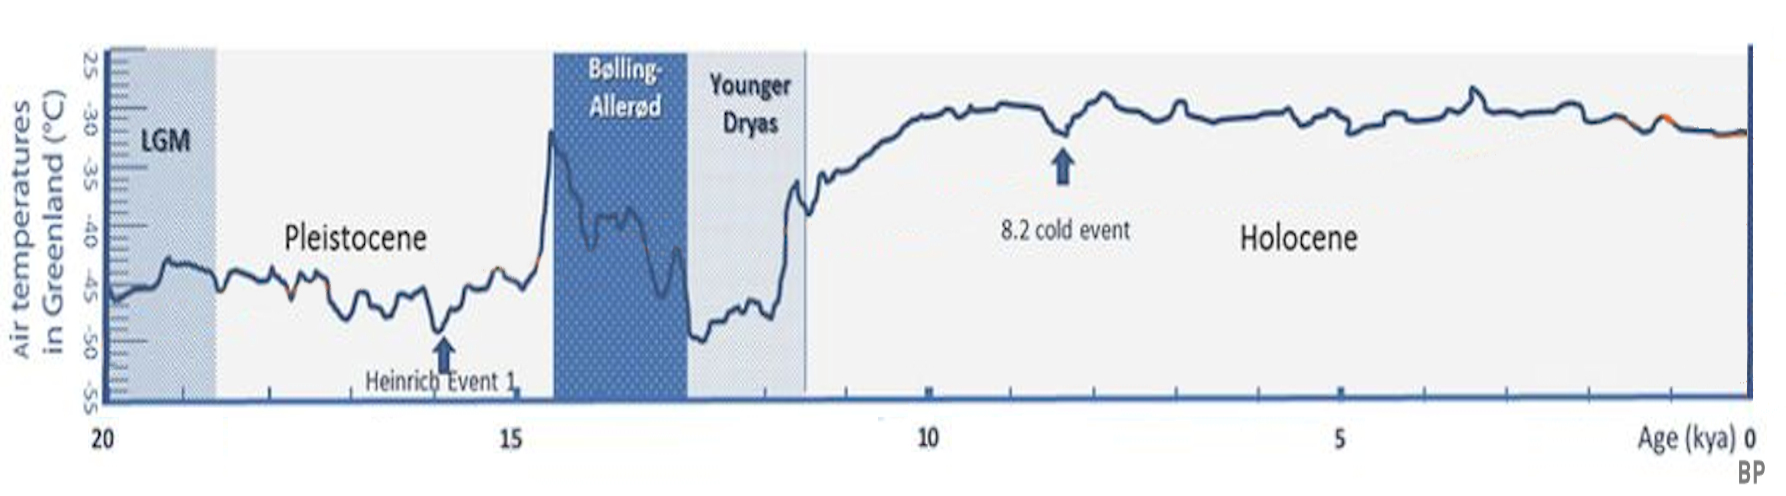
English: Reconstructed air temperatures from the GISP 2 Ice core in Greenland |
||
| Tarikh | |||
| Sumber |
Mapping Post-Glacial expansions: The Peopling of Southwest Asia |
||
| Pengarang | Daniel E. Platt, Marc Haber, Magda Bou Dagher-Kharrat, Bouchra Douaihy, Georges Khazen, Maziar Ashrafian Bonab, Angélique Salloum, Francis Mouzaya, Donata Luiselli, Chris Tyler-Smith, Colin Renfrew, Elizabeth Matisoo-Smith & Pierre A. Zalloua | ||
| Versi lain |
|


Perlesenan
Fail ini dilesenkan di bawah lesen Pengiktirafan-Perkongsian Serupa 4.0 Antarabangsa Creative Commons.
- Anda bebas:
- untuk berkongsi – untuk menyalin, mengedar dan memindah hasil kerja
- untuk mencampur semula – untuk menyesuaikan karya
- Di bawah syarat berikut:
- pengiktirafan – Anda mesti memberi penghargaan yang berpatutan, bekalkan pautan ke lesen, dan tunjukkan jika perubahan telah dibuat. Anda boleh lakukannya dalam sebarang cara yang munasabah, tetapi bukan dalam sebarang cara yang mencadangkan pemberi lesen mengendors anda atau penggunaan anda.
- perkongsian serupa – Jika anda mengubah, adun semula, atau menokok tambah bahan, anda mesti menyebarkan sumbangan anda di bawah lesen yang sama atau serasi dengan yang asal.
Sejarah fail
Klik pada tarikh/waktu untuk melihat rupa fail tersebut pada waktu itu.
| Tarikh/Waktu | Gambar kenit | Ukuran | Pengguna | Komen | |
|---|---|---|---|---|---|
| semasa | 20:41, 16 Mei 2019 | 1,786 × 496 (281 KB) | पाटलिपुत्र | better | |
| 11:24, 16 Mei 2019 | 1,786 × 372 (238 KB) | पाटलिपुत्र | User created page with UploadWizard |
Penggunaan fail
Laman berikut menggunakan fail ini:
Penggunaan fail sejagat
Fail ini digunakan oleh wiki-wiki lain yang berikut:
- Penggunaan di af.wikipedia.org
- Penggunaan di ar.wikipedia.org
- Penggunaan di ca.wikipedia.org
- Penggunaan di de.wikipedia.org
- Penggunaan di en.wikipedia.org
- Penggunaan di es.wikipedia.org
- Penggunaan di fr.wikipedia.org
- Penggunaan di he.wikipedia.org
- Penggunaan di id.wikipedia.org
- Penggunaan di ie.wikipedia.org
- Penggunaan di it.wikipedia.org
- Penggunaan di ja.wikipedia.org
- Penggunaan di kk.wikipedia.org
- Penggunaan di lfn.wikipedia.org
- Penggunaan di ru.wikipedia.org
- Penggunaan di te.wikipedia.org
- Penggunaan di th.wikipedia.org
- Penggunaan di tr.wikipedia.org
- Penggunaan di vi.wikipedia.org
- Penggunaan di zh.wikipedia.org